
Amazon customers behavior dashboard
For this project, I assumed the role of a data analyst for Amazon, a multinational technology company focusing on ecommerce in Seattle, Washington.

Dataset used:
Dataset- Amazon customers behavior dataset with over 598 rows for the month of June 2023.
Data cleaning & Analysis - Microsoft excel and Power Bi
Data visualization tool- Power Bi
About the Project:
Amazon conducts a comprehensive monthly analysis of their customer data to gain insights into customer experiences and challenges. These insights are leveraged to address issues and enhance overall customer satisfaction. In the context of this project, my responsibility was to analyze customer behavior data specifically for the month of June 2023. The ultimate objective is to formulate a data-driven report outlining strategies for improving customer experience.
To accomplish this goal, I delved into the following key questions:
Customer Count for June 2023: I determined the total number of customers who engaged with Amazon during the month of June 2023.
Customer Satisfaction Rate: I evaluated the level of customer satisfaction based on available data to quantify how content customers were with their interactions.
Purchase Frequency Analysis: By examining customer behaviors, I assessed how frequently customers made purchases during June 2023.
Cart Abandonment Analysis: I identified the primary factors contributing to cart abandonment, shedding light on areas that require attention to reduce this issue.
Popular Purchase Categories: Through data exploration, I pinpointed the product categories that experienced high purchase rates in June 2023.
Service Appreciation and Feedback: I discerned which of Amazon's services received the most positive feedback from customers and which ones were less favorably received.
Service Enhancement Opportunities: By analyzing customer sentiments and feedback, I identified specific areas within Amazon's services that could benefit from improvements.
By addressing these questions and extracting meaningful insights from the data, I was able to provide a comprehensive report outlining strategies to enhance customer experience. The analysis serves as a valuable foundation for Amazon to make informed decisions and implement targeted improvements that resonate with their customers.
Data cleaning process
I initiated my analysis by creating a new worksheet on Microsoft Excel, which serves as a repository for inputting customer data. This sheet offers a handy reference for future use. To ensure a solid understanding of the dataset, I conducted a preliminary review, acquainting myself with each column's contents and the overall dataset structure.
My data preparation commenced with an initial filtration, targeting and subsequently removing any blank entries. This step laid the foundation for cleaner and more reliable data.
A significant step in the process involved extracting the date component from the timestamp column, a task accomplished utilizing the Left function. This extraction enhances the dataset's usability and allows for more streamlined temporal analysis.
The next phase involved the migration of the meticulously cleaned dataset into Power BI, a powerful platform for in-depth data analysis. Within Power BI, I harnessed the split column function, effectively dividing the purchase categories column. This strategic categorization facilitates a more nuanced and insightful exploration of the data.
By methodically executing these steps, from data filtration and extraction in Excel to thorough categorization within Power BI, I've established a robust foundation for deriving comprehensive insights from the customer data. This structured approach equips me to delve further into the data and extract meaningful patterns and trends that will contribute to the enhancement of customer experience strategies.
Insights
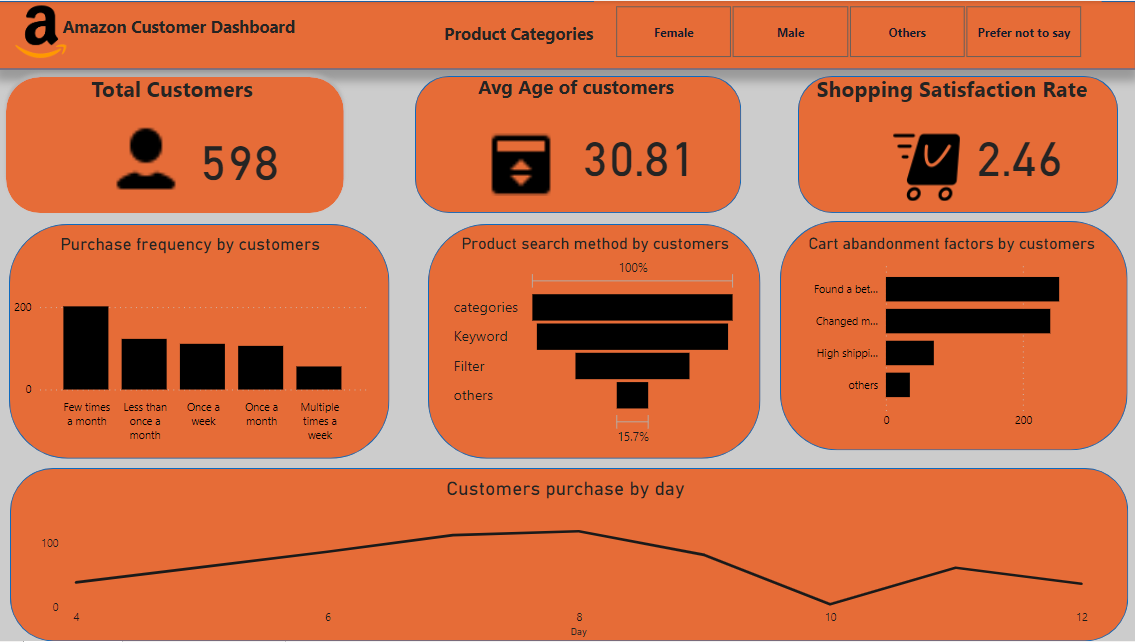
Customer Count and Gender Distribution: The total customer count for the month of June was 538, comprising 349 females, 141 males, 19 customers falling into other categories, and 89 customers who chose not to disclose their gender. While being a multinational technology company, the overall customer count appears lower than expected.
Satisfaction Rate Evaluation: The average satisfaction rate of 2.46 is notably low, indicating a need for substantial improvement in customer experience.
Purchase Frequency Pattern: A significant portion of customers made purchases a few times a month, signifying a consistent engagement with the company's products.
Cart Abandonment Factor: The primary reason for cart abandonment was customers finding better prices elsewhere. Addressing pricing competitiveness is crucial to reducing this abandonment factor.
Popular Purchase Category - Beauty and Personal Care: Beauty and personal care emerged as the most frequently purchased category, correlating with the higher number of female customers in June.
Service Appreciation and Improvement Opportunities:
The service most appreciated by customers was product recommendations, suggesting its effectiveness in enhancing the shopping experience.
Quick delivery, on the other hand, received less appreciation, indicating a need for improvements in the delivery department to meet customer expectations.
Service Enhancement Focus - Customer Service Responsiveness: The data underscores the importance of enhancing customer service responsiveness. Addressing this area is crucial for ensuring timely and effective support, leading to increased customer satisfaction.
In conclusion, the analysis sheds light on critical areas demanding immediate attention. Boosting the customer count, elevating the satisfaction rate, and optimizing services such as delivery and customer service responsiveness are pivotal steps in elevating the overall customer experience. These insights serve as a solid foundation for formulating targeted strategies that align with the company's goals and aspirations.
Recommendations
The company should prioritize a comprehensive review of its media and advertising team's strategies. Ensuring that the advertisement efforts are accurately targeting the intended audience and devising strategies to enhance overall visibility is crucial for improved outreach.
Addressing the notably low average satisfaction rate necessitates a multi-faceted approach, particularly focusing on rectifying service-related deficiencies. A thorough evaluation of the delivery department, customer response team, and any other areas with subpar customer ratings is imperative to drive a significant improvement in customer experience.
To combat the prevalent issue of cart abandonment, implementing a strategic discount or price reduction on goods could serve as an effective solution. This step can directly address the customer-identified obstacle and potentially encourage greater conversions.
Enhancing the customers' ability to effectively search for goods is a valuable initiative. Embedding a user-friendly video tutorial on the company's website, prominently visible to customers, can guide them on proper keyword-based product searches. This approach is poised to streamline the shopping process and enrich the overall user experience.
Incorporating these recommended actions into the company's strategy demonstrates a proactive commitment to enhancing customer satisfaction, rectifying pain points, and fostering a more positive and productive relationship between the company and its valued customers.